LLM Wiki Part 2: What Happens After Deployment, Knowledge Graphs, Multiple Wikis, and Automated Business Insights


In the previous article, you learned how to deploy an LLM Wiki in 5 minutes with Claude Code and Obsidian, the raw/wiki/index/log structure inspired by Andrej Karpathy's gist.
This time, we look at what happens next. When your wiki starts living, growing, and connecting ideas you never linked before.
When an LLM Wiki has been running for months with dozens of ingested sources, the result is striking: a knowledge system that gets smarter with every ingestion, capable of generating visualizations, finding invisible connections, and producing actionable business insights.
What changes when the wiki is no longer empty
The difference between a freshly deployed LLM Wiki and one that has been running for weeks? Connection density.
Each ingested source creates 5 to 15 pages (concepts, entities, sources, analysis). After 20 sources, you have roughly 200 interconnected pages. After 50 sources, the graph starts looking like an actual brain.
The real magic happens when the LLM starts finding connections between sources you would never have crossed.
Multi-source ingestion in practice
A real LLM Wiki feeds on more than just articles. Here is what you can ingest:
- YouTube transcripts: each video becomes new pages of concepts, tools, techniques
- Meeting recordings: notes, decisions, idea evolution over time
- Web articles and URLs: the LLM reads and synthesizes directly from the link
- PDFs and system cards: technical docs, whitepapers, proposals
- Personal notes: thoughts, ideas, client feedback
The LLM decides how to structure each source. Sometimes a 50-page PDF generates 20 wiki pages. Sometimes a quick note creates just 2 or 3.
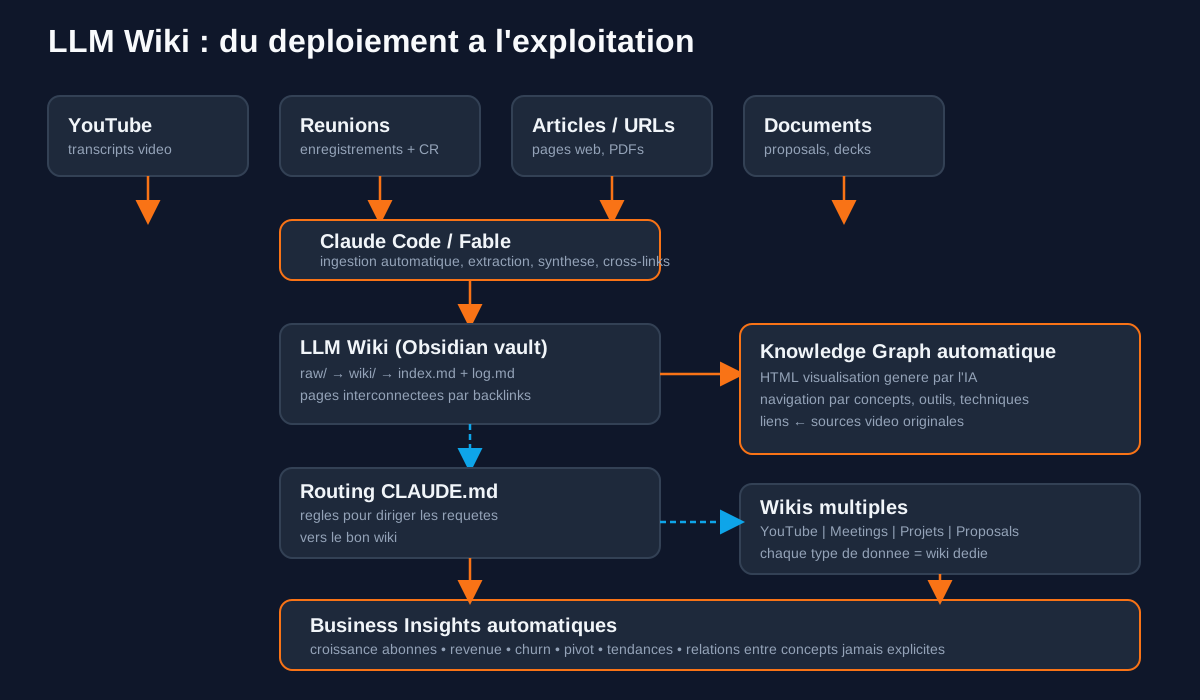
Auto-generated knowledge graph
The most impressive part shown in the video: the LLM can generate an interactive HTML visualization of the entire wiki from a single prompt.
The user asked: "Turn this messy blob of YouTube transcripts into something people could look at and understand. Something simple that is not overwhelming, showing how tools and techniques connect."
The result: an interactive web page with:
- Key concepts at the top (agentic workflows, routines, automation)
- Clickable links between every concept
- Source videos displayed for each idea
- Full navigation through the graph
What makes this superior to a manual attempt with a classic model (e.g., Opus 4.8): the LLM understood emotionally what makes an interface usable by a beginner. Not just technically correct, but truly accessible.
Why this is not just a pretty graph
A visualization is nice. But the real power is what the LLM can discover by browsing its own wiki.
Concrete example: two ingested sources, an OpenAI article on GPT-5.6 and the Claude Fable 5 system card. Intuitively, you would read them separately. The LLM Wiki automatically created a "Frontier Model Cybersecurity" page linking both. Why?
Because OpenAI benchmarked GPT-5.6 against Mythos Preview, but the two labs used different harnesses. The numbers did not align directly. A human reading both documents separately would miss this nuance. The wiki created the connection automatically.
This kind of unexpected cross-reference is where the system's real value lives.
Multiple wikis: separate without isolating
An advanced pattern: instead of one monolithic wiki, create multiple wikis by data type:
| Wiki | Content | Structure |
|---|---|---|
| YouTube | Video transcripts | Concepts, tools, techniques organized |
| Meetings | Internal/external meetings | Flat, chronological |
| Proposals | Quotes and proposals | By client, by status |
| Intelligence | Articles and benchmarks | By topic, by source |
Each wiki has its own structure, decided by the LLM based on data type. A YouTube transcript wiki naturally creates subfolders (comparisons, concepts, sources, techniques, tools). A meetings wiki stays intentionally flat.
Key point: the LLM analyzes content and adapts structure dynamically. No imposed schema.
Routing: how agents navigate between wikis
Having multiple wikis is great. Knowing which one to query for which question is better.
The solution: routing rules in your main project's CLAUDE.md. Each agent knows:
- Read each wiki's index to understand its contents
- Route the query to the relevant wiki
- If needed, combine answers from multiple wikis
Example: an agent preparing a newsletter can query the YouTube wiki for trends, the meetings wiki for client decisions, and the intelligence wiki for benchmarks, all in one request.
The ultimate calculation: extracting business insights
Once the system is running, you can ask it things no traditional reporting tool can provide.
In the video, the user asked their LLM Wiki (fed with 6 months of data):
"Build me a visual journey of what we have accomplished in the past 6 months."
The result in a single shot:
- Subscribers gained
- Highest revenue month
- Churn and conversion evolution
- Automatic detection of the strategic pivot (from end-to-end content to Claude Code content)
- Pivot impact measured (average views, revenue, growth)
- The entire business funnel, proving the system understands how people enter the ecosystem
All without dashboards, BI tools, or SQL queries. Just the accumulated knowledge in markdown files.
The portability of markdown
The best part? Every wiki page is a standard markdown file.
No proprietary database. No locked format. No vendor lock-in.
You can:
- Version everything with git
- Connect any agent (Claude Code, Codex, Cursor, Hermes)
- Share individual pages
- Generate slides with Marp
- Search with Dataview or qmd
The LLM Wiki is not a product. It is a file format. And that is why it is so powerful.
Conclusion
The LLM Wiki does not stop at deployment. That is where it all begins.
After a few weeks of ingestion, you get:
- A knowledge graph that densifies on its own
- Connections between sources you had not seen
- Auto-generated visualizations
- Specialized wikis by data type
- A routing system for your agents
- Business insights extracted in natural language
All in markdown files you control.
If you have not deployed your LLM Wiki yet, start with the first article. Then ingest your first sources and watch the system evolve on its own.
To go further in building your agentic stack, explore our AI Skills Hub and our GTM AI Tool Directory.
Build your enterprise Knowledge Graph with an Externalized AI Direction
Linking company knowledge into a graph enables AI agents to understand deep context and act with maximum relevance.
With our Externalized AI Direction, we deploy your knowledge architecture:
- Modeling business concepts and interconnecting company data sources.
- Interfacing this Knowledge Graph with your automation and outreach agents.
- Maintaining data hygiene to power accurate strategic decision-making.
🎁 Access the 1000 Skills Hub
Get ready-to-run workflows to deploy and operate your LLM Wiki in production.